Introduction
It would be frustrating if you went in for a physical exam, and the doctor simply said: “yes, you’re healthy” or “no, you’re not healthy. See you next year.”
Heaven forbid you hear the latter. How do you work on that? Eat more greens and hope for the best?
In the same way, as important as the revenue numbers are at the end of the quarter or year, it’s even more critical that revenue leaders know why their teams are either soaring over or crawling under their revenue targets.
Before the wider adoption of sales execution platforms (SEPs) and revenue operations (RevOps) strategies, it was possible to offer a good guess. (For instance, eating greens probably does move you in a positive direction).
However, today, revenue leaders can use their SEPs—and often integrations with customer relationship management systems (CRMS)—to monitor the real time health of their sales systems, strategies, and messages.
This piece will give revenue leaders a solid understanding of the KPIs they should routinely monitor to assess sales execution program health and maturity, guide and coach their teams, and make decisions.
Do you really know how your sales execution program is performing?
Download this guide to propel maximum growth in the areas that matter most to your revenue organization.
Assessing sales execution program health
There are four central elements of a sales execution program: systems, messaging, enablement or training, and change management.
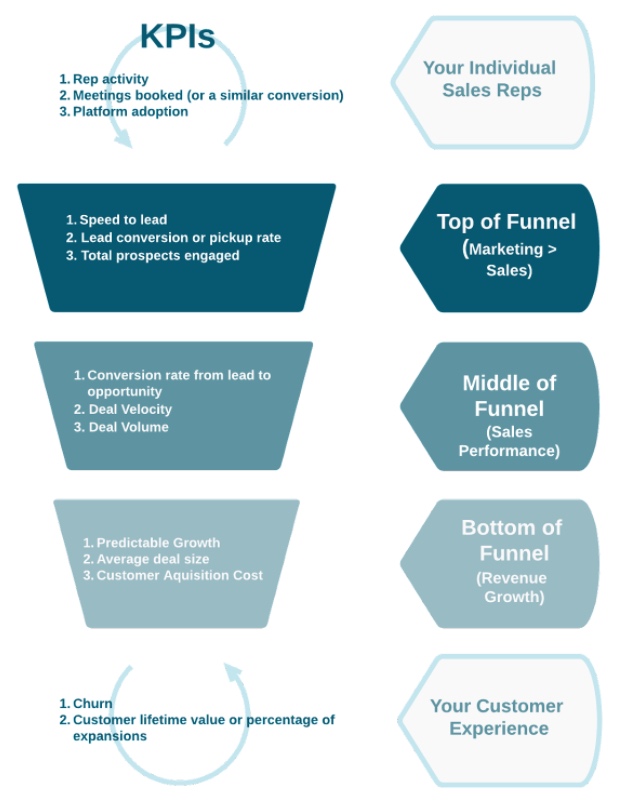
Each of these four elements involves the entire funnel and multiple teams, which is why we’ve broken down the most important KPIs according to where they fit in the overall sales journey.
From preparing and coaching your individual sales reps to handing off a closed/won account to customer success, your sales execution program should align these internal strategies and external interactions for a cohesive buyer experience.
Do your reps know their assets from their elbows?
One of the critical benefits of an SEP is visibility into rep activity. Particularly in remote or hybrid work environments, SEPs provide insight into how reps are spending their time, whether they’re placing enough calls, and if they’re engaging a sufficient volume of prospects.
If these metrics are off, then you have two choices: 1) assume your reps are watching Tiktok all day or 2) ask questions to learn whether there may be a broader enablement or change management issue holding them back.
These KPIs help you to let data inform the way you train, evaluate, and coach your reps to make sure both you and they know your assets from your elbows.
KPI One: Rep activity
A rookie mistake for SEP newcomers is often to prospect like crazy but then drop off when they start to see an uptick in meetings and responses. This phenomenon is known as the Sine Wave of Sales.
Instead, sales leaders should set a KPI for a consistent number of people each outbound sales rep should place into sequence or cadence per week. Even on busy weeks, when they’re juggling prospecting with a lot of discovery calls, it’s critical to set and enforce an expectation here in order to have a sustainable and consistent pipeline.
The number you should set will vary depending on a number of factors, including whether you assign your reps a small number of targeted accounts or shoot for a high-volume outbound approach with lower touch sequences or cadences.
However, reps should have a clear expectation for the number of new prospects they’re to be engaging per week, and with what sequences or cadences. They should also know leadership is watching to see if they’re actually making the dials, as a part of those salesplays, or if they’re slacking off with individual activities.
A high number of skipped tasks, or low connect rates on cold calls, indicates either a performance issue or unrealistic expectations for volume. Either way, your activity KPI will tell you whether your reps are doing what they’re supposed to achieve their key conversion rates.
KPI Two: Meetings booked (or a similar conversion)
Depending on your team’s strategy, this KPI will vary. For some, the goal is to book a meeting for a closer. For full-cycle reps, the ultimate conversion is a sale.
Regardless of what the “finish line” is for your sales reps, you should set a clear KPI for the number of those conversions each rep needs to achieve in a month. Your SEP will either automatically display this KPI for you, or you can work with your sales ops colleagues to create the right dashboards so you can track this in real time.
This KPI should be closely tied to the first. If your reps are consistently following approved strategies and sales plays, then they should be achieving their quotas. If they’re not, then this is not necessarily a reflection on your reps.
Looking further into related metrics, like bounce rates, sentiment data for replies, and the like will give you a clearer picture of whether technical or messaging issues may be hindering your reps’ success.
Especially at first, treating this KPI as a diagnostic tool, and not the live-or-die number that determines whether you fire or promote someone, will help you learn a lot.
In a more mature sales execution program, when messaging and salesplays are more confidently established, then this KPI can become a much more confident standalone snapshot of a rep’s effectiveness.
KPI Three: Platform adoption
While it often takes time to get to this overall team benchmark, we recommend that teams set a goal of 100% adoption, meaning that all reps are utilizing your SEP in the way they’ve been trained and asked to do.
This may be an enablement lift, but it’s both possible and crucial. If some of your reps are following your playbook, using the right sequences or cadences in the right use cases, and others are doing their own thing, then you will have no consistent way of evaluating or rewarding success.
The only fair and clear way to provide incentives, evaluate performance, and give rewards and promotions is to broadcast the universal criteria and expectations it takes to get there. Your SEP provides a path to that objectivity, which is critical in creating a respectful and inclusive workplace.
So once you have loaded in sequences or cadences, and established your other two KPIs in this section, it’s time to set and enforce a KPI around reps logging in, performing their sales activities within the SEP, using approved messaging, and recording things like call dispositions and emails sent from their inboxes.
To track a usage or adoption KPI, we suggest relying heavily on statistics like the number of calls placed, prospects contacted, and recent logins. And if you’re serious about promoting adoption, then after the grandfathering period has passed, reps should not be eligible for reward or promotion based on activities happening outside of your SEP.
How’s the weather at the top of your funnel?
Measuring rep performance is critical for understanding how each member of your sales team is contributing to your overall goals. But your big picture KPIs, showing the health of your overall sales execution program, will focus more on the combined activity happening inside of your sales funnel.
For instance, if you have issues prioritizing inbound versus outbound leads, it will show in your top of funnel KPIs. If sales and marketing are not aligned, and they don’t play well in the sandbox, then these metrics will show you how bad it really is.
If these KPIs are not performing well, then it’s likely that you need to work on change management both within your sales team and in the areas where sales intersects with marketing. Issues here, if left unresolved, will significantly limit the number of sales accepted leads progressing further down your funnel.
KPI One: Speed to lead
It has been well documented that the faster you respond to an inbound lead, the more likely it is that the customer will buy from you. This phenomenon is often called “speed to lead.”
This KPI is a good predictor of whether you will close the business that comes to you, an indicator of whether your sales team has clear direction on how to prioritize prospects, and a signal of whether you have the right lead routing and automation in place.
For instance, sales reps need to know a lead has come through, and they need to have accurate contact information to give them a ring or send an email. If you allow automation to take care of the first steps in this process, then all involved tools need to be properly integrated and set up so the leads receive the right message, on time.
The benchmark used to be 5 minutes, but Chilipiper now advocates that, with the help of automation, your response time should be instant. If this seems like a tall order, then you’re not alone; Drift’s research has found that only 7% of companies hit the 5-minute mark.
However, companies who can meet—or hopefully exceed—this benchmark are the early birds who get the worm. If you set up the right sequences or cadences in your SEP, then you should be able to automatically and instantly place an inbound prospect into a sequence or cadence that begins with an automated email.
If that scares you, then remember this: automated doesn’t mean impersonal. Inbound leads often come with a host of information about what the person is interested in, and that information can all factor into the targeted sequence or cadence they receive.
So whether you’re at “instant” today, or you’re still reaching for the 5-minute window, set a KPI for the fastest possible speed to lead and make the goal increasingly aggressive until you are setting the pace for your industry and competition.
If you continue to hit obstacles, then you should look at the cause. It may be a change management issue with teams holding out on wanting to make a personal call instead of trusting your SEP, or it may be that marketing’s lead-intake system isn’t integrated with your SEP. Marketing may be following a manual process for notifying sales of an inbound lead.
This may not be indicative of a conflict between sales and marketing’s goals and priorities, but it might be. If that makes you nervous, then hang tight. It’s about to get real.
KPI Two: Lead conversion or pickup rate
If your sales and marketing team collaborate on drumming up leads, whether through generating inbound interest or researching possible prospects, then you should be tracking the lead conversion or pickup rate between the two teams.
If this isn’t approaching 100%, meaning that sales is acting on almost every lead coming their way from marketing, then you have a problem.
Setting this KPI will require collaboration from both sales and marketing, as marketing must be open to feedback from sales on the quality (and qualification) of the leads marketing sends them. However, sales should also come to the conversation with humility and curiosity.
Sometimes sales teams are hesitant to take leads from marketing, even if they’re objectively qualified, because they like to find their own fish. While this rugged individualism may be admirable in some settings, it’s a huge waste of resources here.
Resolving this tension and setting an aggressive KPI is a change management challenge, but it’s well worth undertaking. Your company is spending resources on these leads, driving up the cost of customer acquisition (another KPI below), so it’s in everyone’s best interest to work toward alignment, both on lead qualification and expectations for acting on the leads reps are sent.
As with any cross-team collaboration, this process should continuously invite feedback from both teams, and leadership across the organization should be open to frequent iteration.
KPI Three: Total prospects engaged
We’ve already argued for KPIs around reps adopting the SEP. This KPI, however, is related to your entire sales team’s adoption, specifically of the sequences or cadences that are created for them.
This assumes several prerequisites:
- You have an established sales messaging program, which is creating quality sales messaging.
- If marketing is involved in the process of creating sales messages, they are heavily involving reps for ideas, requests, and feedback.
- Your sales team has a full set of approved sequences or cadences, which offer options for your most common use cases and sales plays.
- Reps have been enabled not only to adopt your SEP but also to identify and use these sequences or cadences for their activity.
If you’re not here yet, then you should set KPIs around getting to this point. The best sales plays in the world are only valuable if they’re used.
Teams that have approved content, but still allow reps to create and use their own content, often struggle to get sufficient volume through individual sequences or cadences. Without high volume, it’s nearly impossible to trust your data, A/B testing results, and other insights which inform iterations, strategy changes, and ultimate message quality standards.
Your reps should be included in messaging creation, but that inclusion should lead to a unified set of sales plays, which properly represents the “sales voice,” without sacrificing the consistency you need to learn and scale.
However, once you’ve reached this stage of maturity, it’s time to push for consistent adoption.
How’s it cookin’ in the middle of your funnel?
You judge a good burger by how the middle is cooked (or not cooked, depending on your tastes). Sales funnels are the same way. While the other KPIs matter a lot, these KPIs have a disproportionate impact on your ultimate sales performance.
Your mid-funnel KPIs are all about converting leads to customers quickly and at a sufficient volume. If your sales team can do this, then you’re golden.
Because these KPIs are very sales-focused, you’re relying here on your own systems and processes. Additionally, your entire team “eats” if these KPIs are healthy. As such, you should be able to set a high bar here and create a path to get there, with limited resistance from your reps or colleagues on other teams.
KPI One: Converting leads to customers
You should be measuring your conversion rates, as prospects enter and exit your pipeline. The simplest KPI is often the percentage of sales accepted leads (or sales qualified) your team turns into paying customers.
Before you can take this KPI to the bank, however, you need to be very confident that your sales and marketing team are working well together, with an established process for qualifying leads. As a refresher here, refer to the section above on lead conversion or pickup rates.
Here’s a hint: Many teams create an opportunity when a lead becomes a qualified prospect, and thus enters the sales process. This makes for very clean measurement when you compare the percentage of opportunities which end as closed/lost and which end as closed/won.
Here are a few spots where this can get tricky:
- Your reps might be too picky.
If your sales reps are too stingy with accepting leads, then this number can become inflated. Be careful that they’re not either retroactively disqualifying leads who don’t close or deliberately only taking “sure things,” leaving a lot of opportunity on the table. - Your funnel may be too welcoming.
If your sales funnel is too open, and you’re not properly qualifying leads before accepting them as sales prospects, then this number will be disproportionately low. - Be careful with industry benchmarking.
Your revenue shop is unique, and it’s hard to set a goal based on another company’s success. For instance, some sales teams look for a very high volume of prospects and do a lot of outbound. Those teams will have a lower average conversion rate than a sales team that focuses on very specific outreach and drumming up inbound interest. The people coming into those funnels are going to be more vetted, with higher intent. Naturally, though the volume is smaller, the conversion rate on this strategy will be much higher.
KPI Two: Pipeline velocity
Once you’ve set your KPI for your overall conversion rate, you can start to measure how quickly buyers move through your sales process. This metric isn’t as easily captured as some of the others, so here is some advice on getting started:
- Pick a clear starting line.
This might be from the first time your sales team contacts them (or they contact you), at the moment of transition from marketing to sales, or when you create an opportunity. - And a finish line.
Let your SEP help you out here, and use your opportunity stages. If you have an opportunity stage like “Closed / Won,” then you have an obvious moment to stop the clock. - Integrate with your CRM.
If you haven’t already integrated your SEP with your CRM, then this is a great motivation. When your SEP and CRM are connected, you can have maximum visibility into what’s going on with your opportunities. Your SEP does not automatically report on this metric for you.
Assuming you have an integration in place, you can compare the date when an opportunity was created to when it closed. This may require a custom field to capture the creation date, but it’s well worth it for the ability to track, over time, how fast your deals are moving.
KPI Three: Deal Volume
We suggest making sure you monitor this KPI at least monthly, looking to see how many new opportunities have been created. This metric may be a direct reflection on sales, or it may be a high-level gauge on both the marketing and sales teams.
If this number is looking low, then it’s time to look at some of the metrics higher in the funnel. Are marketing and/or outbound reps generating enough leads? Are a sufficient percentage of those sales qualified? Are your reps getting to them in time to capture their interest?
On the other hand, if this number increases, but your conversion rate drops, then it’s a signal that your reps are taking on more prospects than they can handle. If you start to emphasize volume above other KPIs, then your customers may start to feel like your sales process is sloppy or rushed.
Volume should be considered as part of a contextual picture of your sales funnel, rather than a standalone statistic.
So are you makin’ the bacon?
All of the metrics we’ve discussed so far lead us to the KPIs that capture the reason you get paid: making your company money.
There are numerous metrics you can monitor to better understand how effective your sales team is at generating revenue, but we have picked the three that we believe are the most critical: predictable growth, average deal size, and customer acquisition cost (CAC).
Other KPIs focus on capturing activity: how quickly your reps move people through a process, how many prospects go through said process, how many interactions it takes, etc. But when the rubber meets the road, those activities will not mean much if your deals are too sporadic, small, or taxing on your team’s time and resources.
These KPIs will tell you whether the deals your sales team is chasing and closing are worth their while, and whether you can expect the bacon to keep on coming.
KPI One: Predictable growth (or forecasting)
Predictable growth is one of the key value propositions for sales execution. However, it doesn’t happen automatically. Sales execution “hobbyists” who use their SEPs for some of their sales activities, while dabbling with other tools and strategies, will not get there.
If your revenue team puts in the hard work to write solid sales messages, learn which sequences or cadences are the most successful in each common sales scenario, and follow that process persistently, then you should start to see that a consistent prospecting volume produces a consistent set of meetings, opportunities, and sales.
To see how you’re doing, you will track, month over month, your critical KPIs. After a quarter or two, you should start to see patterns emerging, which can inform educated guesses about future quarters.
Here are a few metrics to watch:
- Deal volume
- Meetings booked**
- Conversion rates
- Total closed/won opportunities
As these metrics become more and more consistent, producing an expected average, your revenue numbers should follow.
**Outreach.io offers a reporting feature that monitors your reps’ activity, forecasting how many meetings each is expected to close by the end of the month. It will also aggregate that reporting, on your team’s dashboard, to tell you how many meetings an entire sales team is likely to book by the end of the month.
KPI Two: Average deal size
Average deal size is an important KPI because time is money. While a closed/won deal is always good news, it’s better news when it’s a valuable deal with a high profit margin.
Monitoring your average deal size is a good way to make sure your sales team is going after the right accounts. If your reps are mostly selling the smallest solution, package, or offering you have, then it’s time to step back and evaluate strategies to find fish with bigger pockets.
This may mean recalibrating expectations for deal volume and velocity, for instance, as larger accounts may require more time and attention. However, like with every other KPI we’ve covered, keep in mind that this is a balance. You still need your small fish, too. That’s why this number is reported as an average.
KPI Three: Customer acquisition cost (CAC)
CAC is a metric that will require input from marketing and sales. How much did marketing spend on last month’s MQLs? How much did your sales team spend on swag, travel, or other direct costs?
If you really want to get into the weeds, you can also look at your sales reps’ time, sales tools, and other infrastructure.
Regardless of how deeply you dive into your costs, it’s important to understand the average dollar amount your company is paying for each customer. Especially when compared against the average deal size, you can start to see whether you’re spending your resources efficiently and in a way that’s likely to produce the highest possible revenue for your company.
Yes, but are your customers happy?
Your sales team may be “done,” when the ink is dry (or the doc is returned with an e-signature) on a deal. But the true sales process continues long after. This is especially true for software companies that depend upon renewals, and make most of their money only as customers retain the service for a year or more.
As such, no sales program is complete without continuing to monitor KPIs throughout the customer success function. That’s why Revenue Operations (RevOps) teams include customer success reporting and operations, and why we suggest that customer success has a seat at the table, as you write your sales messages.
You can look at a lot of places to tell how your customer success team is doing, but the two KPIs that we care the most about are: churn and lifetime value.
KPI One: Churn
One of the benefits of a sales execution program is alignment on messaging. If your marketing, sales, and customer success teams are collaborating, and the same core messages are reflected in every customer interaction, then your company is much more likely to deliver on promises and keep customers happy.
However, it can’t be prevented. Some customers will leave. What matters is not whether some people pack their bags and go elsewhere. It’s how many.
The commonly-cited industry average churn for B2B is 5%. This is an annual statistic, so you shouldn’t panic if you see a spike around the end of the year, for instance, when many teams are reconsidering budgets. It should level out, with other months with very low churn.
Keep in mind that noticing your own patterns and trends, as well as establishing your own “normal,” is way more important than hitting a generic benchmark. And if your churn numbers are high, it’s time to bring together marketing, sales, and customer success to understand which customers are churning and why. You may learn that you need to tweak your qualification criteria and aim for different prospects.
KPI Two: Lifetime value or customer expansions
As churn goes down, and you retain more of your customers, the potential increases for upsells and cross-sells. You will naturally make more money on customers, as they renew year over year, but your sales team should also be involved in customer success’s strategies to approach current customers with opportunities for upsells or cross-sells.
In order to track this, you can take several approaches:
- Monitor the quarterly or yearly average percentage of your customers who have upsold. If you’re not seeing numbers here in line with your expectations, then it’s time to sit down with customer success and create a nurture sequence or cadence with more personalized touches, in advance of an upcoming renewal, to establish greater value.
- Monitor the above, plus the addition of the average dollar amount of each upsell.
- If you’re really feeling wild and crazy, you can calculate a true lifetime value for each customer, using a formula that considers variables like customer value, purchasing value, and purchasing frequency.
Here’s what you should do next
Now that you have a good idea of what KPIs revenue leaders like you should be monitoring, it’s time to pick the ones which are most critical to you, talk with your sales ops team or SEP expert to understand how to view this KPI in action, and start tracking your results.
When your sales execution program’s systems, messaging, enablement, and change management are all “cooking,” then each one of these KPIs should hum right along.
If your team is underperforming in any area, then our experts can help diagnose the problem and prescribe a collaborative solution that will help your sales execution program to run like a healthy organism.
Lastly, just in case, it’s probably still best to eat more greens.